Combining automated and interactive visual
analysis of biomechanical motion data
 |
 |
 |
 |
 |
|||
|
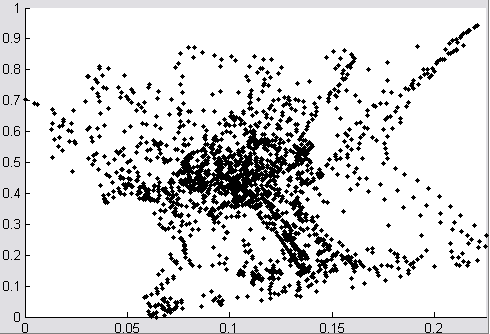
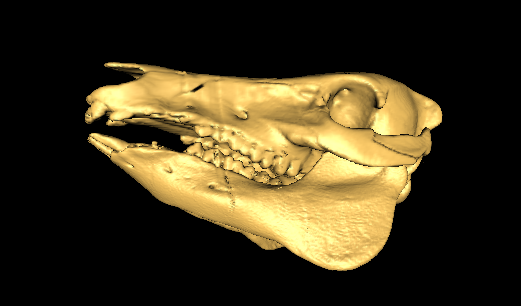
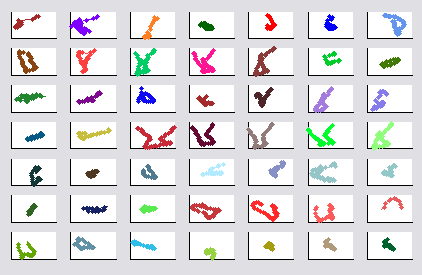
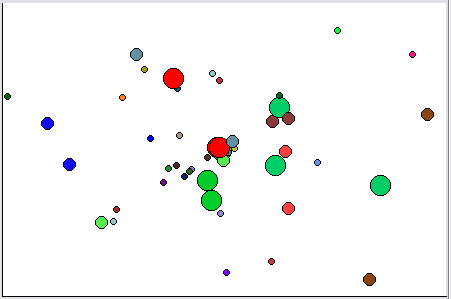
The overview of our interactive visual analytics system. (A): The embedding view. (B): The 3D visualization view.
(C): The segment view. (D): The cluster view. (E): The timeline view.
|
|||
People
Scott Spurlock Remco Chang Xiaoyu Wang George Arceneaux IV Daniel F. Keefe Richard SouvenirAbstract
We present a framework for combining automated and interactive visual analysis techniques for use on high-resolution biomechanical data. Analyzing the complex 3D motion of, e.g., pigs chewing or bats flying, can be enhanced by providing investigators with a multi-view interface that allows interaction across multiple modalities and representations. In this paper, we employ nonlinear dimensionality reduction to automatically learn a low-dimensional representation of the data and hierarchical clustering to learn patterns inherent within the motion segments. Our multi-view framework allows investigators to simultaneously view a low-dimensional embedding, motion segment clustering, and 3D visual representation of the data side-by-side. We describe an application to a dataset containing thousands of frames of high-speed, 3D motion data collected over multiple experimental trials.
Citation
Scott Spurlock, Remco Chang, Xiaoyu Wang, George Arceneaux IV, Daniel F. Keefe, and Richard Souvenir. Combining automated and interactive visual analysis of biomechanical motion data. In International Symposium on Visual Computing (ISVC), volume 2, pages 564-573, November 2010.